Analytics
The Analytics page is used to review call center performance for a selected period. The set of available data and charts depends on the user role.
- Moderator and Senior Agent see aggregated analytics across all agents, orders, and directions.
- Agent sees only personal metrics — data related to their own work.
Here you can track:
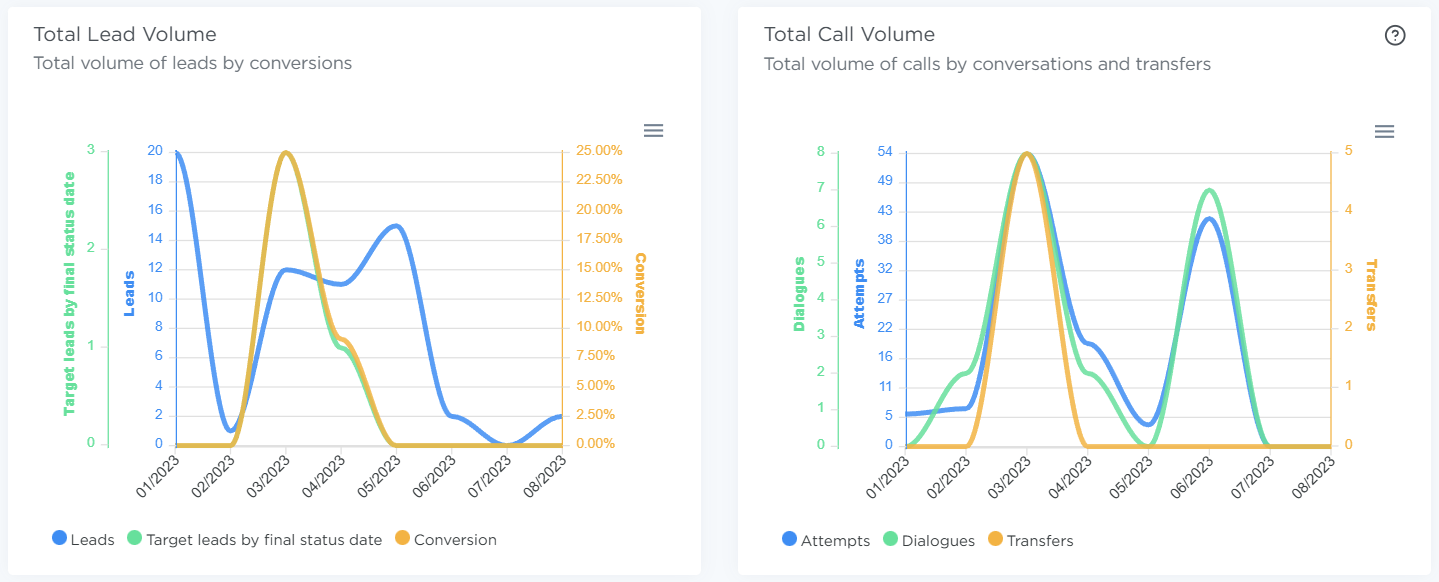
- how lead and call volumes change over time,
- agent conversion rates and workload,
- how work is distributed across time,
- the results of a specific agent.
How the page works
At the top of the page, there is a Filter block. It allows you to narrow down data by date range, orders, lead types, and other parameters.
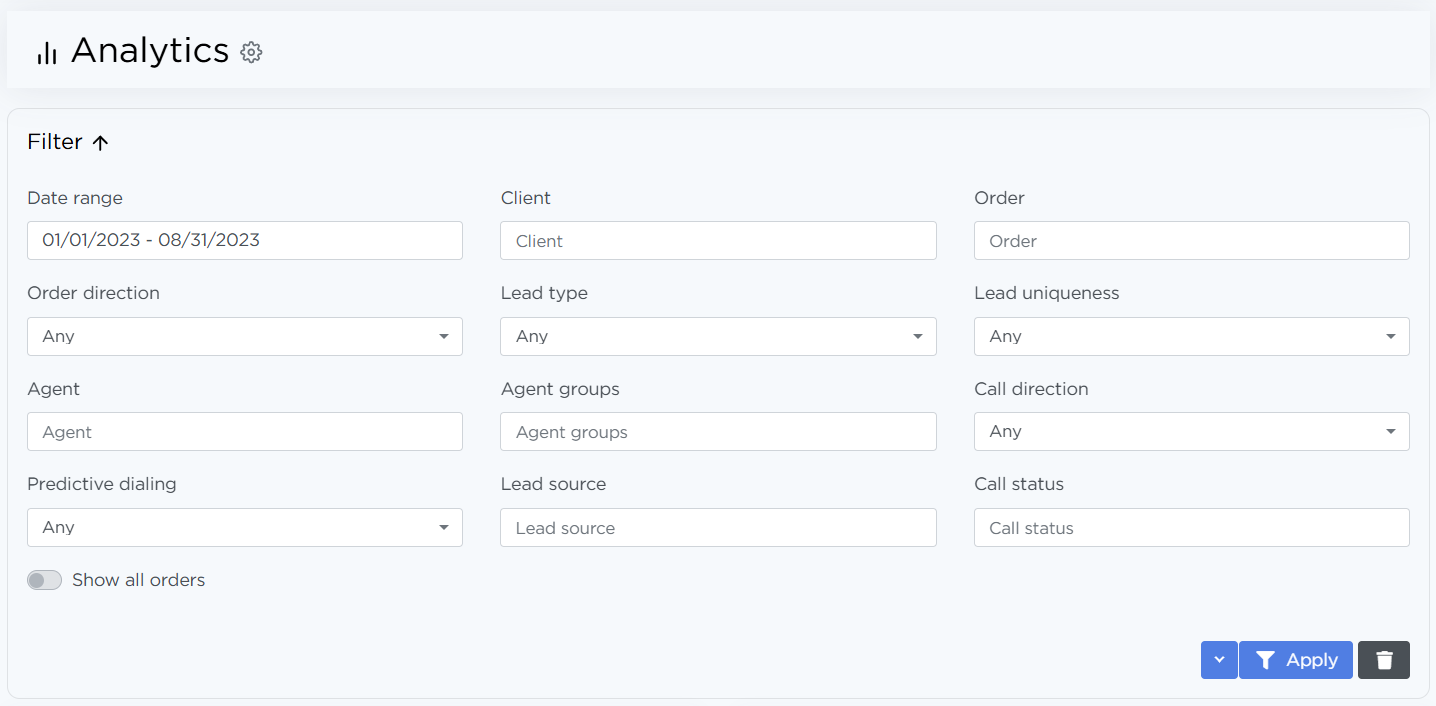
If no data matches the selected filters, the chart area will display a “No data” message instead of a graph.
Analytics for senior agents
Senior agents use this page to monitor overall call center performance and compare agents with each other.
Key charts
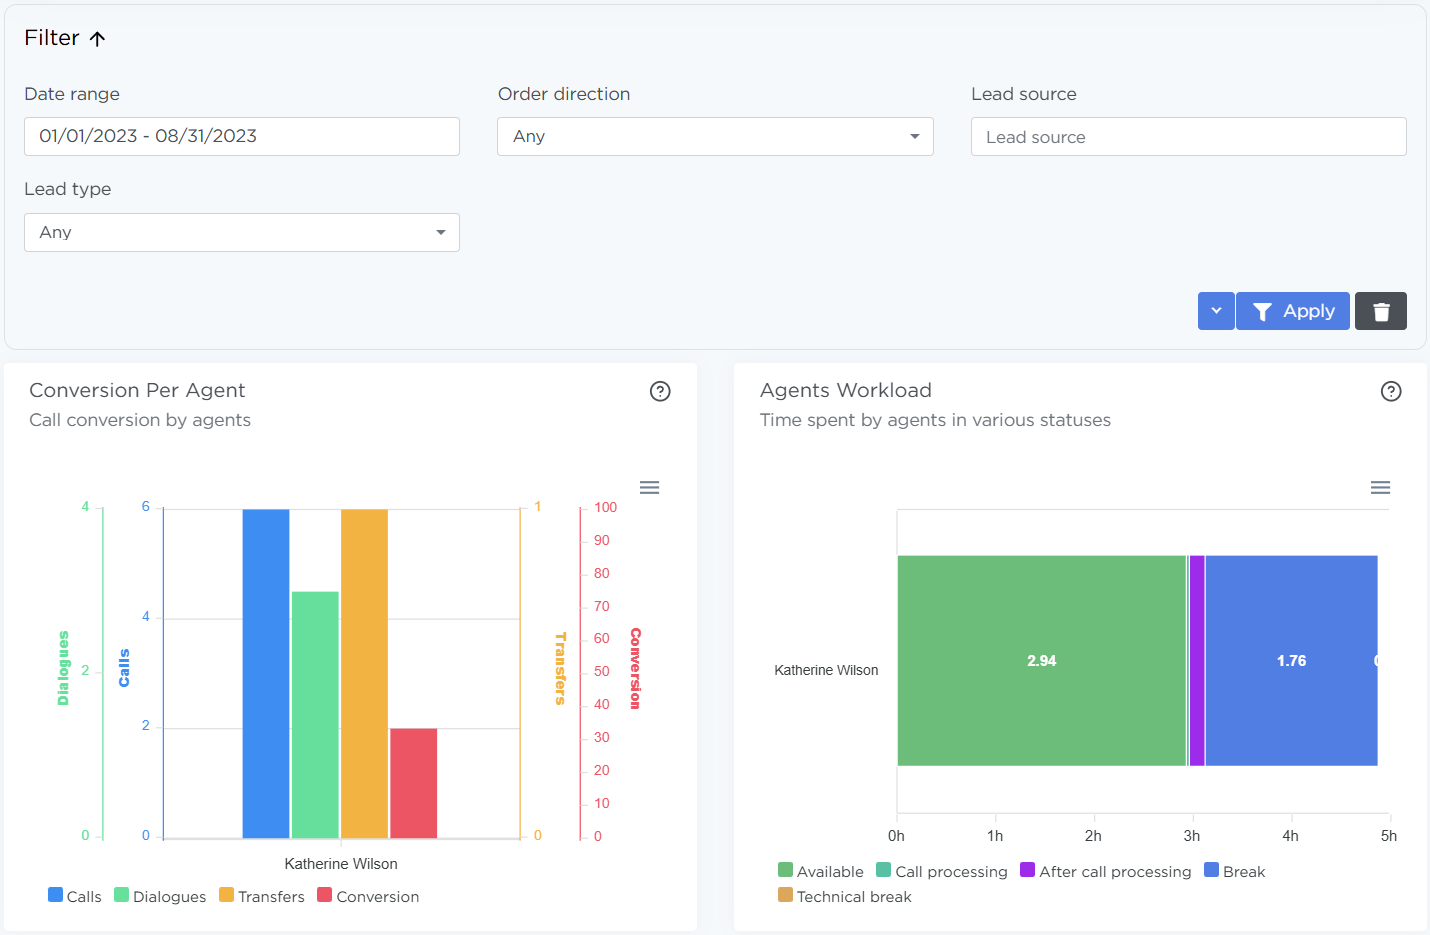
Conversion Per Agent
Shows how agents work with leads:
- total number of calls,
- number of completed conversations,
- number of leads converted into target leads,
- overall conversion rate.
This chart is useful for comparing agent performance and spotting quality issues.
Agents workload
Shows how much time agents spent in different statuses. It helps you understand actual workload and how working time is distributed.
Call Processing
Displays the average time spent at each call stage:
- dialing,
- conversation,
- after-call processing.
This chart is used to evaluate process efficiency and identify bottlenecks.
Productivity
Shows the average number of:
- calls per hour,
- conversations per hour.
The metrics are calculated based on agents’ working time and help assess their pace of work.
Analytics for agents
Agents only have access to personal analytics — strictly their own data. Comparing results with other agents is not available.
Key charts
Conversion Per Agent
Shows:
- number of personal calls,
- number of conversations,
- number of target leads,
- overall conversion rate.
Used for self-monitoring and understanding personal performance.
Calls Processing
Shows how an agent’s working time was distributed across different statuses. It helps assess actual workload during a day or selected period.
Productivity
Shows the average number of calls and conversations per hour for the selected period. Used to evaluate personal work pace and performance trends.
Additional options
- The dashboard settings icon allows you to hide or show individual charts.
- Each chart supports data export (CSV, PNG, SVG).
- Filter settings can be saved as presets for quick reuse.